Tracing
You have the possibility to see parameter's values of your functions after a simulation, in order to check their behavior.
Tracing with barectf
This feature of tracing enables to trace several kinds of elements : transitions, operations (activity and flows), states, classes... Furthermore, its impact on the execution performances of the simulation are minimized because the generated traces are under the CTF format.
Prerequisites
This feature needs to access to the tool "barectf".
It can be installed through the following command line (in cmd.exe) on a system with python installed (preferably python 3).
pip install barectf
Check if barectf is correctly installed
barectf --version
If an error is returned, type in cmd.exe the following command line:
pip install markupsafe==2.0.1
Preferences
The tracing preferences can be changed in the preferences menu of Sim4Sys Designer.
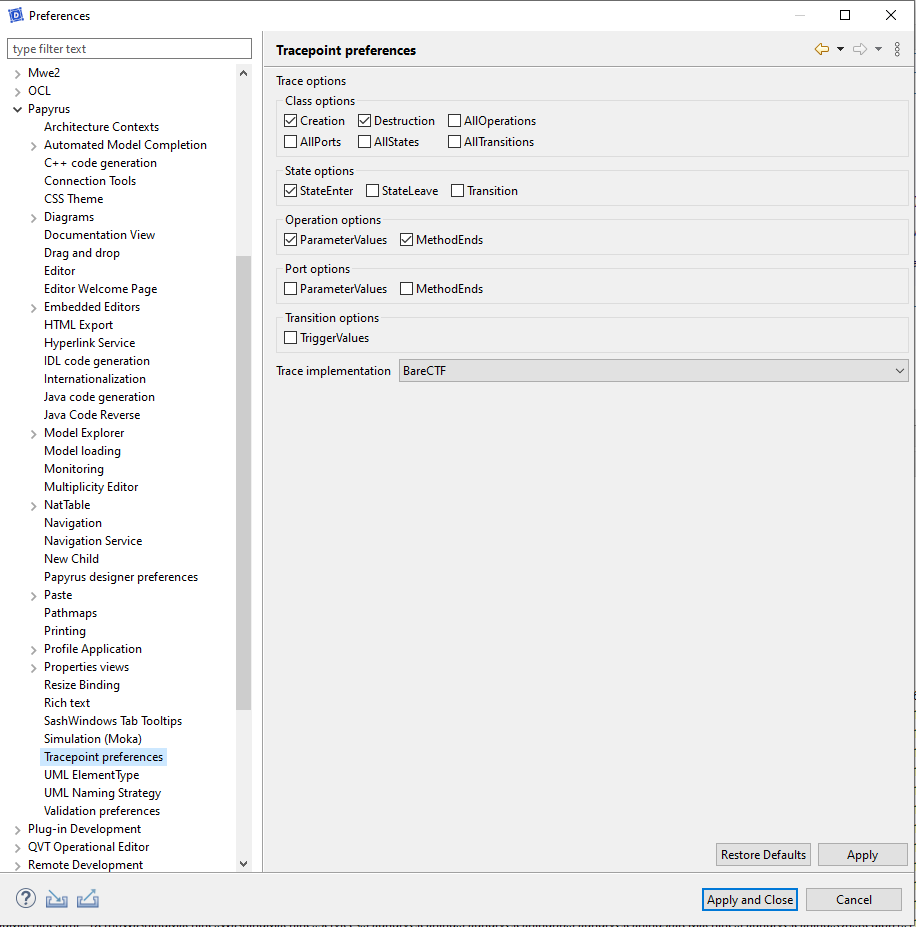
The available options are available :
- Class
- Creation : Trace the creation of an instance of this class.
- Destruction : Trace the destruction of an instance of this class.
- All Operations : Trace all operations of the class with the options applicable to the operations.
- All Ports : Trace all ports of the class with the options applicable to the ports.
- All States : Trace all states of the class with the options applicable to the states.
- All Transitions : Trace all transitions of the class with the options applicable to the transitions.
- State
- State Enter : Trace the entry in a state.
- State Leave : Trace the exit from a state.
- Transition : Trace all transitions of the state with the options applicable to the transitions.
- Operation
- Parameters Values : Trace all the parameter values of the operation.
- Methods Ends : Trace the end of execution of the operation.
- Port
- Parameter Values : Trace all the parameter values of the operation executed through the port.
- Methods Ends : Trace the end of execution of the operation executed through the port.
- Transition
- Trigger Values : Trace the trigger values of the transition.
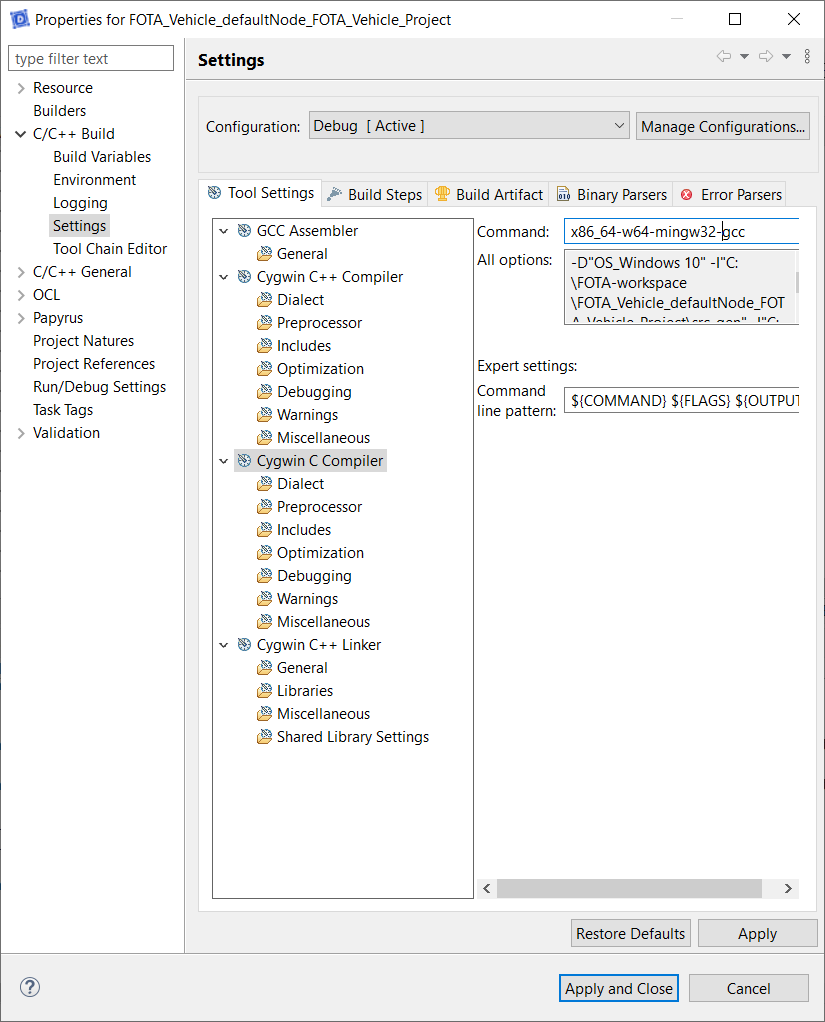
If you use MinGw compiler you must change the command for the C compiler : x86_64-w64-mingw32-gcc
Manual tracing
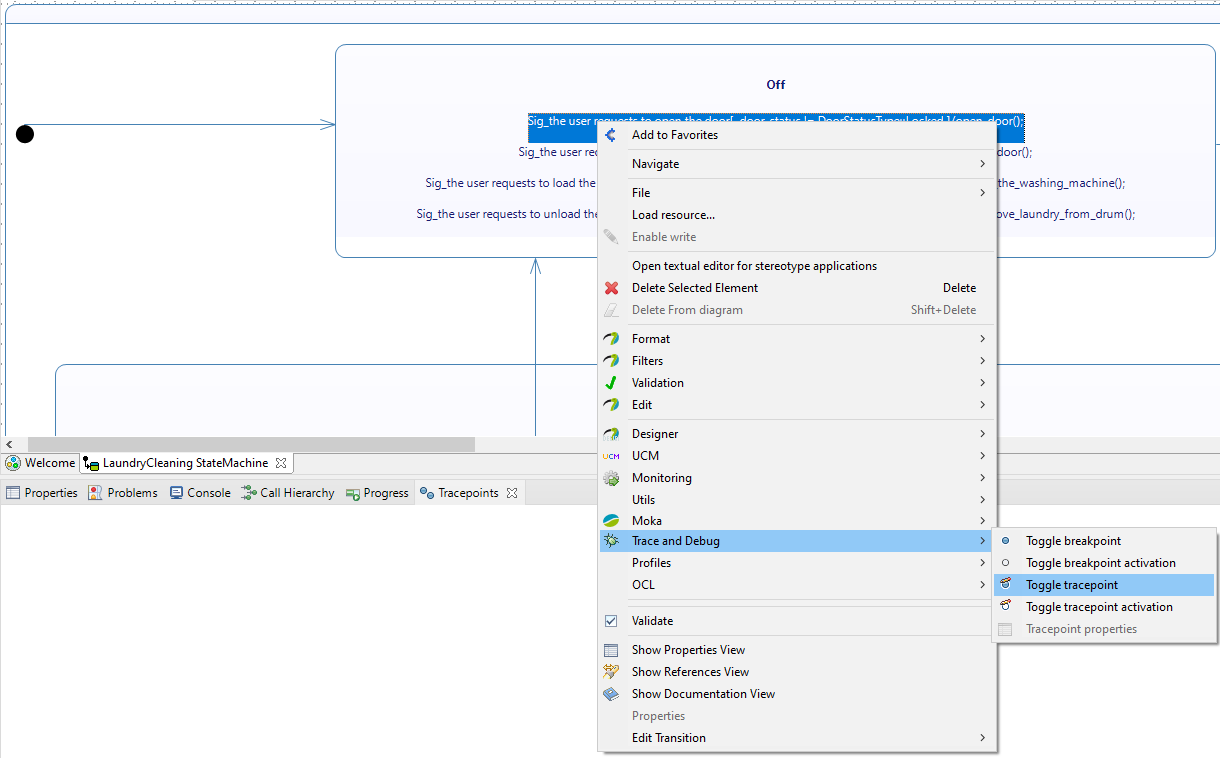
To generate a trace during the execution, you first have to choose which elements have to be traced. Sim4Sys Designer provides some convenient ways (see next section) but you can also add tracepoints manually in the model through the contextual menu > Trace and Debug > Toggle tracepoint.
Guided tracing
To accelerate the settings of the tracepoints, Sim4Sys Designer provides some convenient ways by proposing tracing templates. This tracing templates are applied to a whole model through the menu in the toolbar Sim4Sys > Tracing > Apply Tracing Templates

You can then choose the templates to apply to the model.
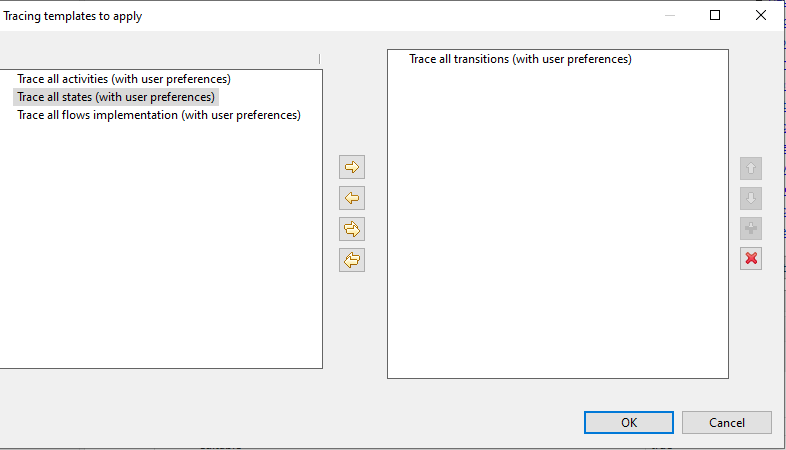
When a template is applied, the tracepoints can be visualized through the diagram view.

They can also be visualized through a dedicated view for tracepoints.

Generate code with tracing
The code is instrumented for tracing during the generation. To ensure tracing, it is needed to select the checkbox in the column tracing when the code generation is launched.
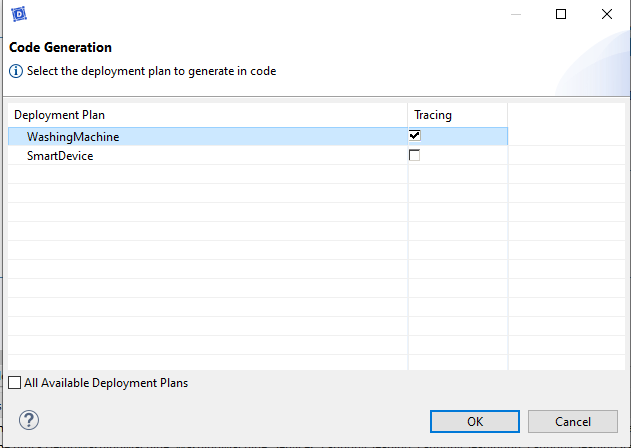
When the code is executed and if traces are generated, a folder will be indicated at the beginning of the execution.
To ensure that the traces are filled correctly, close the executable with CTRL + C instead of using the stop button when your scenario is done.
You are only entitled to 20 trace folders by default (from "ctftrace00" to "ctftrace19").
If you do not rename, move, or delete these folders, the model executable will crash on 21nd launch.

Reading of generated traces
Sim4Sys Designer includes features to read CTF traces more easily. A "Trace Project" can be created through the menu File > New > Project... > Tracing > Tracing Project
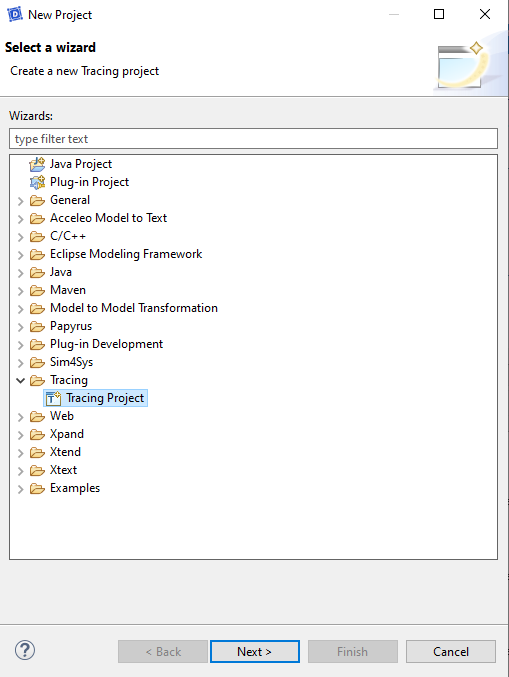
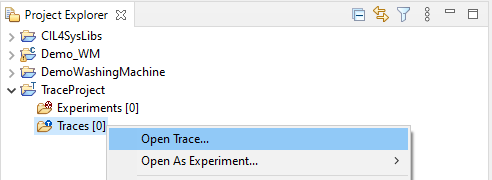
Then a generated trace can be imported in this new project.
The trace can then be visualized under a raw but readable form.
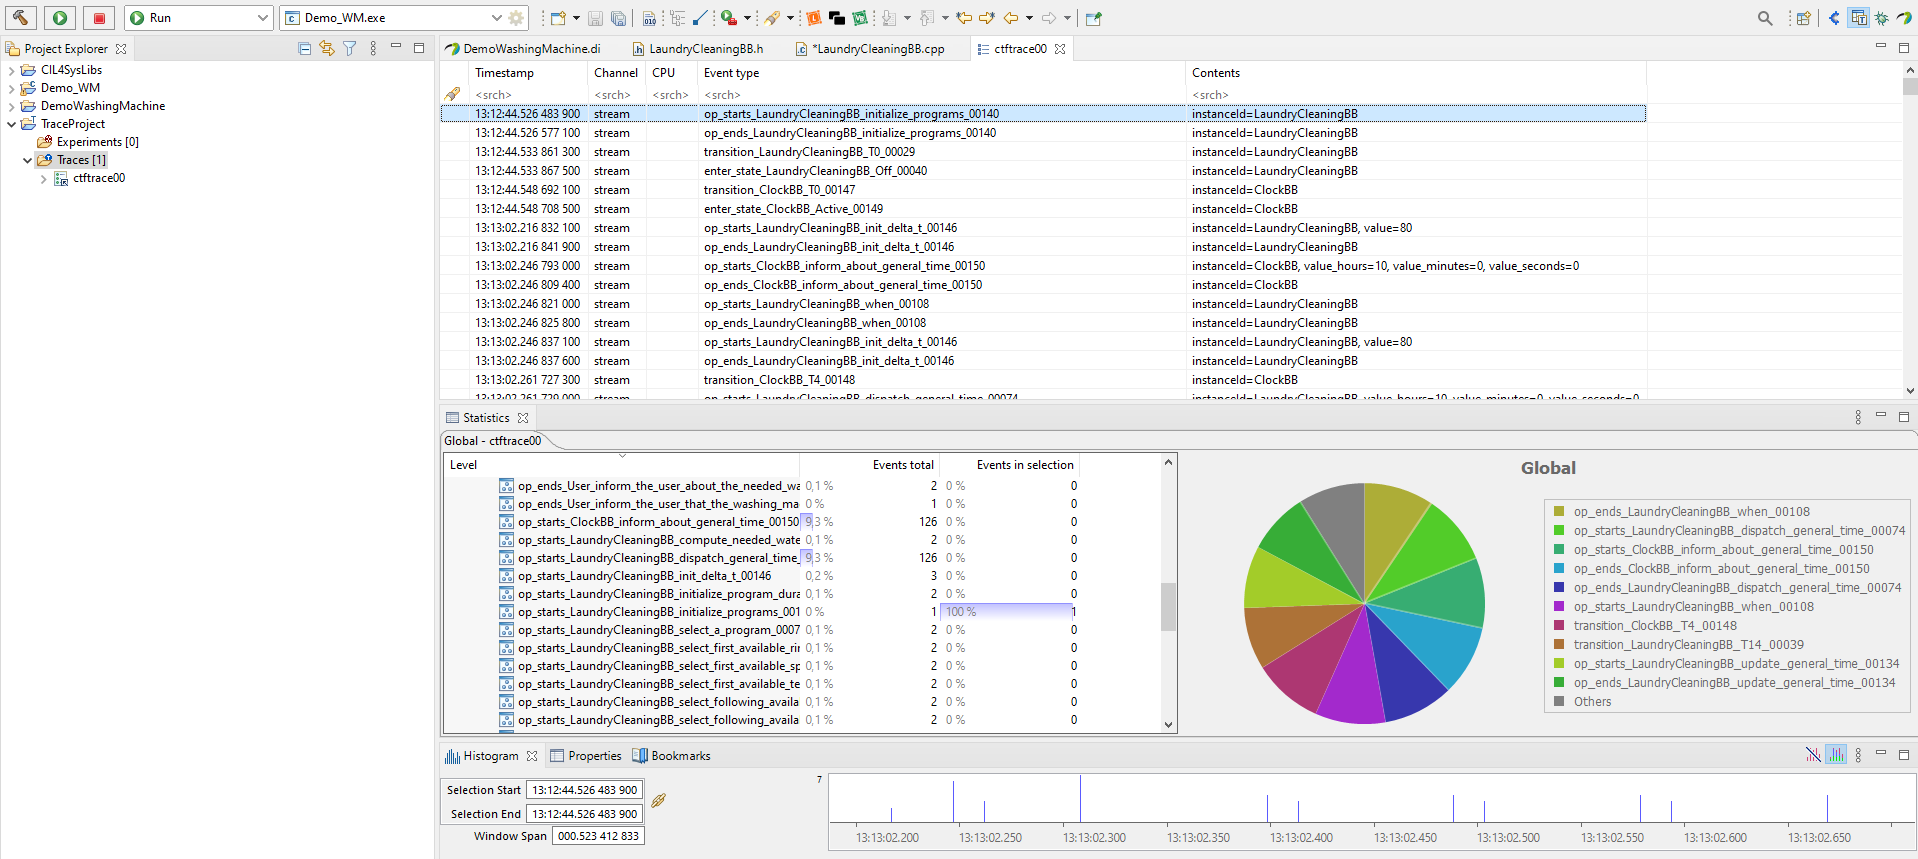
Right click on the trace > Export to Text enables to export the file under csv format.
Coverage of generated traces
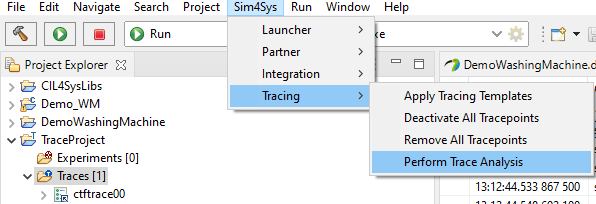
Some convenient ways to get report or automated analysis of generated traces are provided. It can be accessed through the menu in the toolbar Sim4Sys > Tracing > Perform Trace Analysis
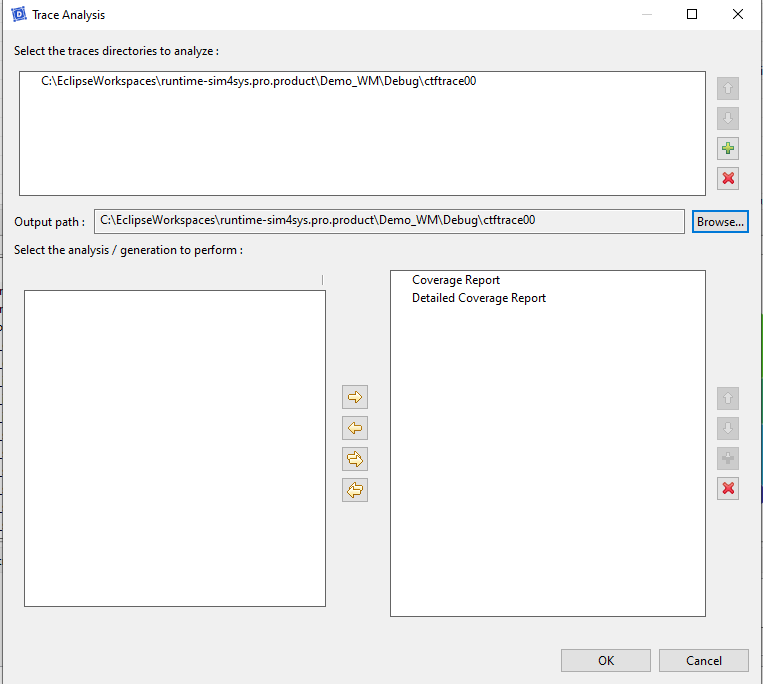
Some analysis are available and in particular analysis on the coverage rate. To perform an analysis, the traces to analyze (several can be analyzed simultaneously), the analysis to perform and the output path have to be selected.
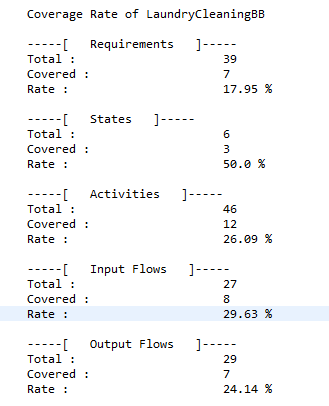
The following report gives an example of a possible result.
Step-by-step summary
When the model is ready to be generated :
- Go to Sim4Sys -> Tracing -> Apply tracing templates, then select all or some of the templates on offer.
- In the Overview, select the model to generate then proceed to the building ([Code] Generate and build). Don't forget to select "Tracing".
After that, you have two options to run the newly created file :
- Use the launcher as usual.
- Launch the executable in the system explorer using the command prompt ("cmd").
Don't use Powershell.
- Play the model into Virtual Bench.
- When the scenario is done, in the two cases, you must close the executable with
CTRL + C.
There are two complementary solutions for analysing the traces produced:
- Go to Sim4Sys -> Tracing -> ¨Perform Trace Analysis.
- Fill in the path to the traces newly directories to analyse (by default, in the debug folder), fill in the output path that you wish, then select all or some of the templates on offer.
- Some .txt files will be created in the output directory.
- Go to File -> New -> Project -> Tracing -> Tracing Project.
- Right-click on Traces -> Open Trace..., find the generated traces folder (e.g: ctfTrace00) and select a file (it doesn't matter which one, they will all be analyzed).